Web scraping in Python and creating a live dashboard with Shiny and Flexdashboard in R
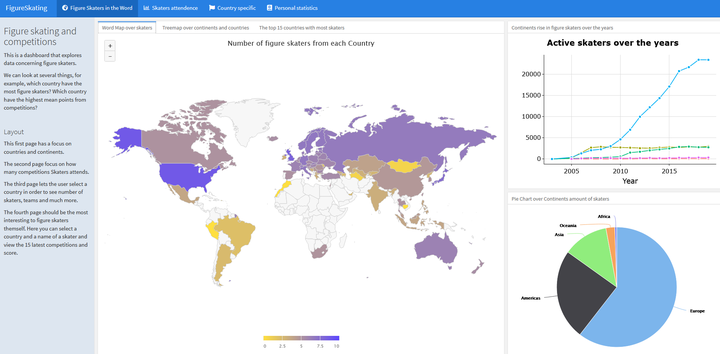
The picture above is from the live dashboard that I created.
This was a fun project for me because I learned so much and used many different tooltips! The mission was to extract data from a website that contains information on figure skaters from all over the world.
I used Python in order to scrape the data by using Beautiful Soup and Pandas, I also cleaned the data in Python.
The next step was to visualize and create a dashboard. Python have some good options for this however, R is according to me much better because we can use Shiny and Flexdashboard which is easy to use and offers all visualizations that you can do in R.
The live dashboard can be viewed on this link: Link to the dashboard However, the dashboard takes a while to load so please have patient.